























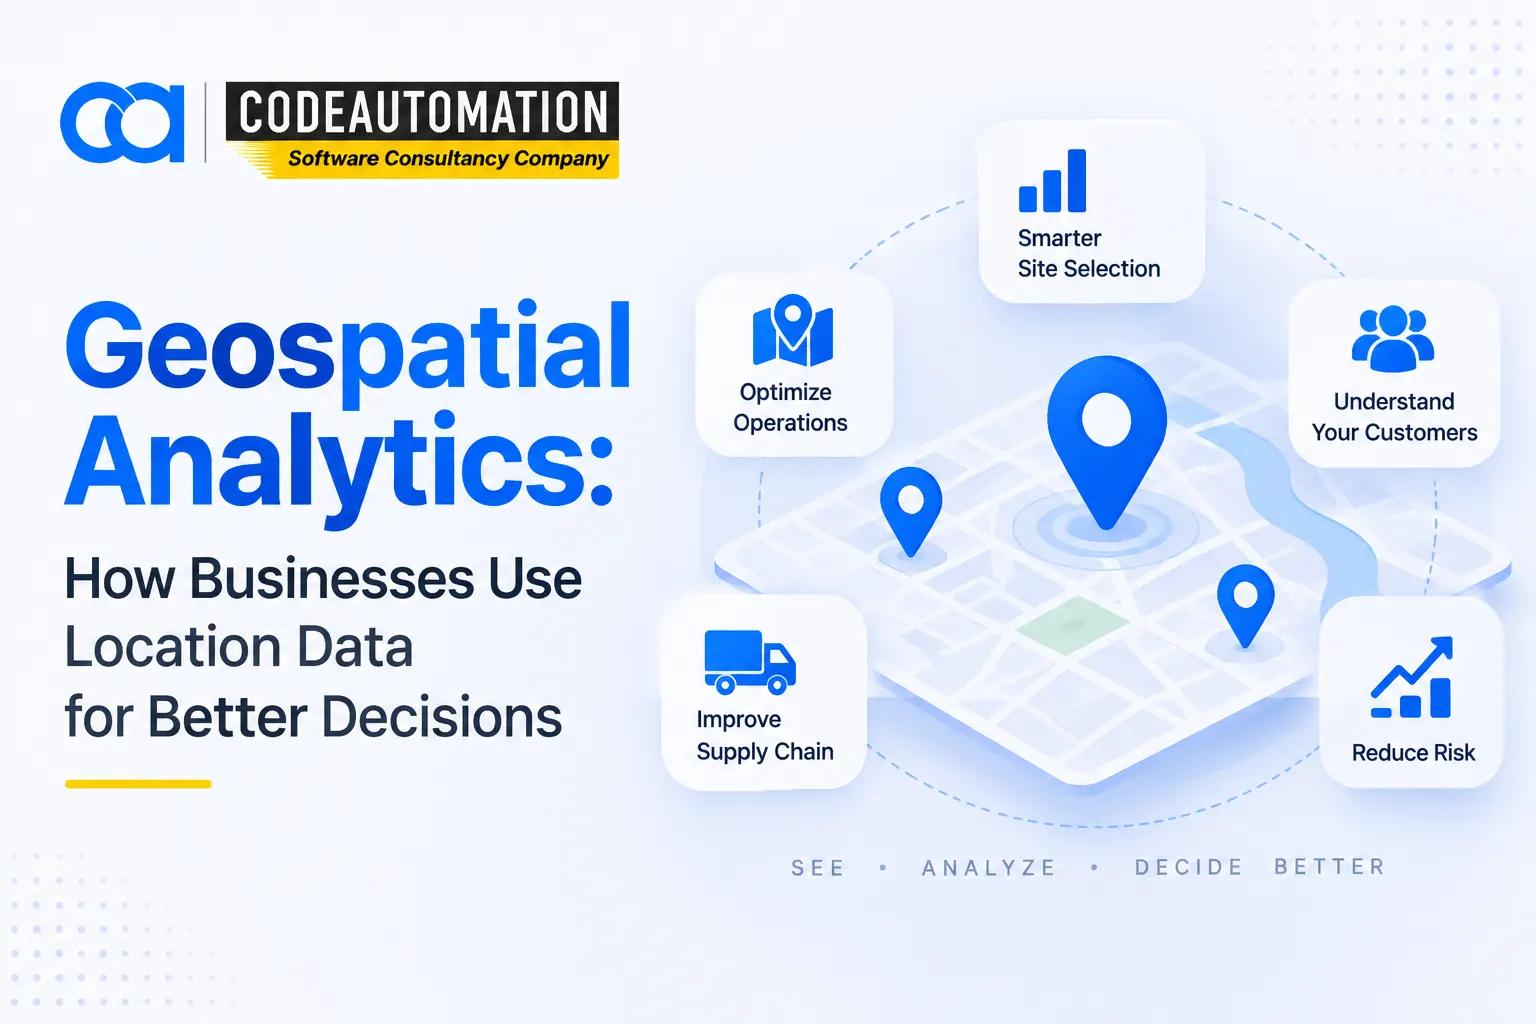
Geospatial Analytics How Businesses Use Location Data for Better Decisions
Published 14/09/2026
Location-tagged records are now generated at a rate no analyst team can manually reconcile: fleet telemetry at sub-second frequency, mobile SDK pings, IoT meter readings, transaction geocodes, and satellite revisits measured in hours. Geospatial analytics extracts signal from that volume by treating geometry as a computable dimension.

Ready to Automate Your Success?
From AI-powered applications to scalable software development, we help businesses automate workflows and accelerate growth.
Book a Free ConsultationLocation-tagged records are now generated at a rate no analyst team can manually reconcile: fleet telemetry at sub-second frequency, mobile SDK pings, IoT meter readings, transaction geocodes, and satellite revisits measured in hours. Geospatial analytics extracts signal from that volume by treating geometry as a computable dimension. The difference from conventional analytics is structural: a standard BI stack aggregates by categorical region and loses everything else, while spatial analysis evaluates distance, adjacency, containment, and directional flow between records. That is where the patterns actually live.
What Is Geospatial Analytics?
Geospatial analytics is the application of statistical and computational methods to data carrying a geographic component in order to quantify spatial patterns, relationships, and forecasts. Geographic data supplies the coordinate framework, points, lines, polygons, and rasters, and spatial analysis supplies the operations that interrogate it, from spatial joins and buffer intersections to clustering and interpolation.
Location information surfaces trends invisible to tabular methods because proximity encodes causality in the physical world. Customer churn clusters around a competitor opening. Equipment failure concentrates along a corridor with shared soil conditions. Neither correlation appears in a spreadsheet grouped by region code.
How Geospatial Analytics Works
Location data is collected from sensors, imagery, and enterprise systems, then processed into a common coordinate reference system with validated geometries. Analysis evaluates geographic relationships, which feature intersect, cluster, or fall within a defined distance threshold, and the resulting measures are delivered as scores, maps, and alerts that feed operational decisions rather than sitting in a notebook.
Geospatial Analytics vs GIS: Understanding the Difference
GIS is the management and visualization layer. It stores spatial data in indexed databases, maintains topology and metadata, and handles cartographic rendering and symbology. Its deliverable is an accurate, queryable representation of geography.
Geospatial analytics operates on that representation to discover patterns, quantify relationships, and generate predictions. GIS provides the foundation, validated geometries, reference layers, and spatial indexes that make analysis computationally feasible. Analytics converts that foundation into business output: a ranked site list, a risk score by parcel, and a projected demand surface. GIS answers where things are; analytics answers what that distribution implies and what should follow from it.
Key Components of Geospatial Analytics
Geospatial Data Sources
Inputs include multispectral and SAR satellite imagery, GNSS and GPS traces from vehicles and devices, census and commercial demographic panels, IoT sensor streams from connected assets, and internal business datasets carrying addresses, store IDs, or service territories.
Spatial Data Processing
Processing covers geometry validation and repair, deduplication, reprojection to a unified CRS, geocoding of unstructured address strings, and integration across schemas with mismatched update cadences. Spatial database management handles partitioning, GiST or R-tree indexing, and incremental refresh so query performance stays flat as volumes grow.
Spatial Analysis Techniques
Core methods include location analysis against catchments and isochrones, pattern detection via hot-spot statistics and density estimation, proximity analysis using distance-based predicates, and relationship analysis through spatial autocorrelation and spatial regression that account for dependence between nearby observations.
Data Visualization and Mapping
Delivery runs on vector-tile interactive maps, geographic dashboards with cross-filtering between spatial and tabular views, and visualization patterns, choropleths, heatmaps, flow lines, and bivariate surfaces, selected to match the analytical question rather than decorate it. The endpoint is a decision-support tool embedded where the work happens.
Predictive Geospatial Analytics
Forecasting models project demand, risk, and utilization forward by geographic unit. Trend prediction extrapolates from multi-temporal series, risk analysis scores exposure against hazard layers, and AI-driven inference detects relationships too complex for parametric models.
How Does Geospatial Analytics Work?
The pipeline runs as a linear sequence: data collection → data processing → spatial analysis → visualization → business decision. Each stage reduces raw coordinate volume into something with decision value attached.
Collecting Location-Based Data
Acquisition draws on GPS and GNSS systems tracking assets and personnel, remote sensing feeds from satellite and drone platforms, and customer or location datasets already resident in CRM, POS, and ERP systems awaiting geocoding.
Analyzing Spatial Relationships
Analysis identifies clustering and dispersion patterns, computes geographic relationships such as containment and network distance, and compares locations on normalized metrics so performance differences reflect actual conditions rather than area size or population artifacts.
Turning Spatial Data Into Insights
Outputs materialize as scheduled reports by territory, interactive maps for exploratory review, predictive scores with confidence intervals, and strategic recommendations that carry the spatial evidence behind them.
Applications of Geospatial Analytics
Geospatial Analytics in Retail and Market Analysis
Footfall and mobility data expose customer behavior across trade areas, catchment modeling informs store location planning, and whitespace analysis quantifies market opportunity against competitor saturation.
Geospatial Analytics in Real Estate
Property analysis blends comparables within dynamic radii, site selection weighs zoning, accessibility, and absorption rates, and market evaluation tracks submarket momentum at parcel granularity.
Geospatial Analytics in Transportation and Logistics
Route optimization solves against live network graphs and time windows, fleet management surfaces utilization by corridor, and delivery planning models drop density to reduce cost per stop.
Geospatial Analytics in Government and Public Services
Urban planning models density and service coverage, infrastructure management tracks asset condition across networks, and resource allocation directs budget toward measurably underserved areas.
Geospatial Analytics in Environmental Monitoring
Climate analysis draws on long-baseline raster archives, land monitoring detects cover change and degradation, and natural resource management quantifies extraction footprints against permitted boundaries.
Geospatial Analytics in Healthcare
Population analysis maps health indicators to catchments, accessibility modeling measures travel time to care, and resource planning aligns facility and staffing capacity with demonstrated demand.
Benefits of Geospatial Analytics
Decisions improve because they rest on modeled spatial evidence rather than regional averages that mask local variance. Operational efficiency rises through optimized routing, coverage, and asset placement. Market opportunities become visible as quantified gaps rather than intuitions. Risk drops when hazard and concentration exposure are measured before capital commitment. Resource optimization follows from allocating against demonstrated geographic need. And planning horizons extend once forecasts are produced per geographic unit instead of enterprise-wide.
How AI Is Improving Geospatial Analytics
Machine learning has shifted spatial work from retrospective description toward automated inference. Pattern recognition models detect clusters and anomalies without predefined rules, predictive analytics forecast at grid-cell resolution, and distributed frameworks process raster and vector volumes that exceed single-node capacity. Real-time scoring pipelines evaluate incoming telemetry as it lands, while GeoAI extracts features directly from imagery. Production deployment of these models is an engineering problem as much as a modeling one, which is why organizations typically scope it alongside dedicated machine learning model development and deployment services rather than leaving experimental code to carry operational load.
AI-Powered Spatial Predictions
Models forecast demand, risk, and movement trends by geography, detect change across multi-temporal inputs before it registers in reported metrics, and support proactive intervention while corrective action still costs less than remediation.
Automated Geospatial Data Analysis
Automation removes repetitive querying and manual digitization, processes continental-scale datasets through tiled distributed compute, and compresses insight cycles from weeks to minutes so outputs remain current when decisions are made.
Challenges of Geospatial Analytics
Data quality is the dominant constraint, invalid geometries, mixed datums, and inconsistent geocoding propagate silently through pipelines. Integration complexity grows with every additional source carrying its own schema, licensing terms, and refresh cadence. Volume forces a shift to distributed spatial compute once raster archives and high-frequency traces outgrow single-node processing. Technical expertise is scarce, since the work sits at the intersection of data engineering, spatial science, and ML. And privacy considerations are non-trivial: precise location is frequently PII-adjacent, demanding aggregation thresholds, row-level security, and auditable access controls.
How Businesses Choose a Geospatial Analytics Solution
Start by defining the business objective, the specific decision under pressure, and the accuracy tolerance it requires. Identify which data sources already exist internally and where third-party acquisition is necessary. Evaluate integration needs against the API surface of your warehouse, CRM, and operational systems. Assess scalability against projected data growth and geographic scope. Then select analytics methods proportionate to the problem: deterministic spatial queries where rules suffice, and machine learning only where pattern complexity justifies the operational overhead. Connecting outputs into existing reporting layers is usually the step that determines adoption, and it pairs naturally with custom business intelligence and dashboard development solutions already governing enterprise metrics.
Future of Geospatial Analytics
The direction is toward AI-driven spatial intelligence operating continuously rather than on analyst request. Real-time location analytics will score streaming telemetry at ingestion. Digital twins will maintain synchronized virtual representations of physical assets and environments. Advanced predictive models, including geospatial foundation models fine-tuned on domain data, will reduce labeling requirements sharply. And tighter integration with IoT and automation will close the loop, letting spatial insight trigger operational action without human relay.
Frequently Asked Questions (FAQs)
Everything you need to know about our products and services
It is the application of statistical, computational, and machine learning methods to location-tagged data in order to identify spatial patterns, quantify geographic relationships, and generate predictions that support business decisions.
GIS manages, stores, and visualizes geographic data, providing the validated spatial foundation. Geospatial analytics operates on that foundation to discover patterns, model relationships, and produce forecasts and scores that drive decisions.
Retail, real estate, transportation and logistics, insurance and financial services, healthcare, telecommunications, utilities, energy and mining, agriculture, environmental consultancy, and government and public sector agencies.
Satellite and aerial imagery, GPS and GNSS traces, IoT and sensor telemetry, demographic and census panels, commercial POI and competitor datasets, cadastral and administrative boundaries, and internal business records with address or coordinate attributes.
AI automates pattern and anomaly detection across large geographies, enables predictive modeling at fine spatial resolution, processes raster and vector volumes beyond manual capacity, and delivers continuously refreshed insight instead of periodic batch analysis.





Adnan Ghaffar is the visionary CEO of CodeAutomation.ai, a platform dedicated to transforming how businesses build software through cutting-edge automation. With over a decade of experience in software development, QA automation, and team leadership, Adnan has built a reputation for delivering scalable, intelligent, and high-performance solutions.
Under his leadership, CodeAutomation.ai has grown into a trusted name in AI-driven development, empowering startups and enterprises alike to streamline workflows, accelerate time-to-market, and maintain top-tier product quality. Adnan is passionate about innovation, process improvement, and building products that truly solve real-world problems.
More Articles

02/ 21/ 2026
Clawdbot: AI Automation for Modern Businesses

16/ 05/ 2026
What Is Agentic AI? Understanding Autonomous AI Systems in 2026

18/ 12/ 2025
Why Odoo ERP is the Game-Changer Your Business Needs: Unlock Its Power for Growth with CodeAutomation

15/ 09/ 2025
How CodeAutomation’s AI Software Development Solutions Can Transform Your Business

03/ 10/ 2026
AI Automation Services That Help Businesses Grow and Scale

03/ 19/ 2026